This archive documents my work in Live Coding class with Melody Loveless, moving from individual code experiments into collaborative audiovisual performance. The class introduced live coding as both a technical practice and a performance language, where code becomes visible, improvised, and directly tied to sound, visuals, and timing.
For the first share-out, I created a Sonic Pi experiment focused on live-coded sound composition.
For the second share-out, I moved into visual coding through Hydra and p5.js, exploring generative visuals, feedback, and real-time image manipulation.
For the midterm, I collaborated with Nikki Tan on an industrial-themed performance. Nikki coded the music, while I coded the visuals. Together, we built a dark, mechanical atmosphere through live sound and reactive visuals. We also created a MIDI synth using Arduino, adding physical interaction and instrumental tones into the performance system.
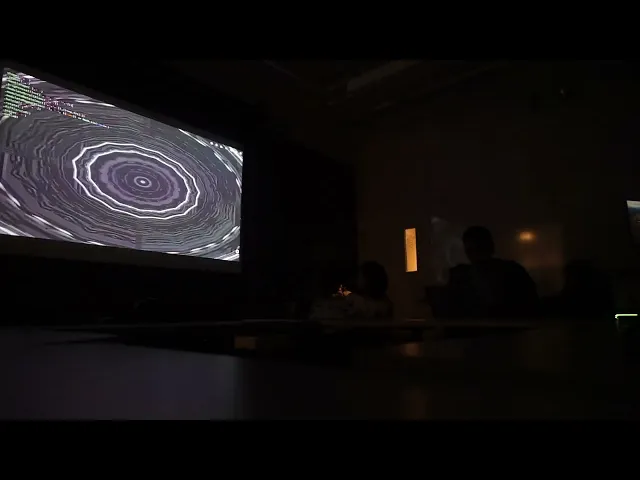
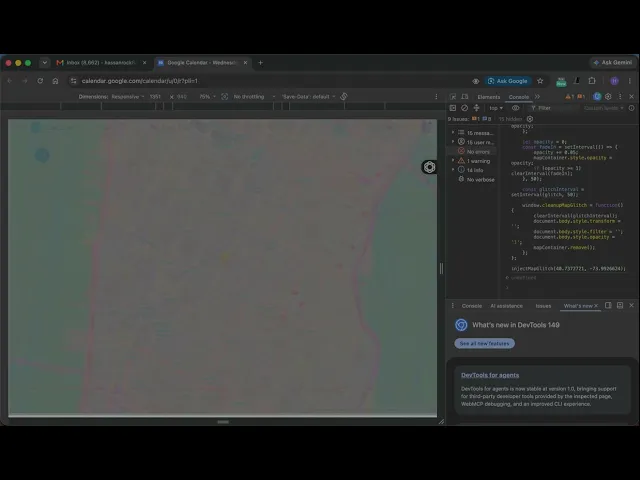
For the final project, I collaborated with Nikki Tan and Hanna Lee on a performance themed around alien invasion, hacking, and psychedelic interference. Nikki performed the sound in Sonic Pi, Hanna created generative visuals in Hydra, and I coded directly into the browser console to create a glitch-hacking effect that revealed a live map. Since Nikki’s laptop was connected to the projector, I wrote and tested my code through Flok.cc so she could paste and run it from her browser console during the performance.
The result was a layered algorave performance where sound, visuals, and browser-based intervention worked together to create the feeling of an alien transmission taking over the screen. My console code injected an OpenStreetMap iframe into the browser, distorted it through randomized movement, hue shifts, saturation, brightness, and opacity changes, and transformed the browser window into a hacked geographic signal.
The performance became a shared system between three performers: Sonic Pi generated the sonic atmosphere, Hydra produced the visual field, and my browser-console code interrupted the screen with a glitching map interface. Together, the piece created a psychedelic hacking invasion that blurred code, sound, image, and location.
This archive documents my work in Live Coding class with Melody Loveless, moving from individual code experiments into collaborative audiovisual performance. The class introduced live coding as both a technical practice and a performance language, where code becomes visible, improvised, and directly tied to sound, visuals, and timing.
For the first share-out, I created a Sonic Pi experiment focused on live-coded sound composition.
For the second share-out, I moved into visual coding through Hydra and p5.js, exploring generative visuals, feedback, and real-time image manipulation.
For the midterm, I collaborated with Nikki Tan on an industrial-themed performance. Nikki coded the music, while I coded the visuals. Together, we built a dark, mechanical atmosphere through live sound and reactive visuals. We also created a MIDI synth using Arduino, adding physical interaction and instrumental tones into the performance system.
For the final project, I collaborated with Nikki Tan and Hanna Lee on a performance themed around alien invasion, hacking, and psychedelic interference. Nikki performed the sound in Sonic Pi, Hanna created generative visuals in Hydra, and I coded directly into the browser console to create a glitch-hacking effect that revealed a live map. Since Nikki’s laptop was connected to the projector, I wrote and tested my code through Flok.cc so she could paste and run it from her browser console during the performance.
The result was a layered algorave performance where sound, visuals, and browser-based intervention worked together to create the feeling of an alien transmission taking over the screen. My console code injected an OpenStreetMap iframe into the browser, distorted it through randomized movement, hue shifts, saturation, brightness, and opacity changes, and transformed the browser window into a hacked geographic signal.
The performance became a shared system between three performers: Sonic Pi generated the sonic atmosphere, Hydra produced the visual field, and my browser-console code interrupted the screen with a glitching map interface. Together, the piece created a psychedelic hacking invasion that blurred code, sound, image, and location.